از لیون کامپیوتر قســـــــــــــــــــــــــــــــــــطی خرید کنید![]() فروش اقساطی برای سراسر ایران
فروش اقساطی برای سراسر ایران
اخبار سخت افزار ، نرم افزار ، بازی و دنیای آیتی در مجله لیون کامپیوتر ![]() 🤩
🤩


vscoder
-
پست
99 -
تاریخ عضویت
-
آخرین بازدید
-
بازخورد
100%
نوع محتوا
نمایه ها
انجمنها
بلاگها
فروشگاه
تمامی مطالب نوشته شده توسط vscoder
-
فروش سی پی یو مادر بورد AMD AM2+ و رم DDR2 و GTX 460
vscoder پاسخی برای vscoder ارسال کرد در تاپیک : خریدو فروش سیستم کامل و چند قطعه کامپیوتر با هم
درود مبلغ مورد توافق دریافت شد و قطعات به صورت حضوری تقدیم عزیزی شد که دوست گرامی Vaioman جهت دریافت قطعات معرفی کرده بودند. موفق و موید باشید. -
فروش سی پی یو مادر بورد AMD AM2+ و رم DDR2 و GTX 460
vscoder پاسخی برای vscoder ارسال کرد در تاپیک : خریدو فروش سیستم کامل و چند قطعه کامپیوتر با هم
درود فروش به پایان رسید و قطعات تقدیم دوست عزیز Vaioman خواهد شد که هماهنگی های لازم با ایشان در پ خ صورت خواهد گرفت. موفق و موید باشید. -
فروش تعدادی متعلقات PS3 نظیر Move+Nav+Charger و بازی
vscoder پاسخی برای vscoder ارسال کرد در تاپیک : خرید و وفروش دستگاههای گیم و بازی
بیا بالا.... -
فروش دو هارد ssd _ او سی زد و اینتل با قیمت عالی ( در حد نو )
vscoder پاسخی برای Elias Bahavar ارسال کرد در تاپیک : خرید و فروش هارد دیسک HDD و SSD
درود مورد Intel رو فوری خریدارم. -
فروش سی پی یو مادر بورد AMD AM2+ و رم DDR2 و GTX 460
vscoder پاسخی برای vscoder ارسال کرد در تاپیک : خریدو فروش سیستم کامل و چند قطعه کامپیوتر با هم
درود قطعات در سلامت کامل به سر می برند و همانطور که قبلا هم ذکر شد مشکل BSOD ناشی از هارددیسک سیستم مغازه بود. این هارددیسک مدت حدودا 2 سال رو با استفاده از این تبدیل های بی کیفیت Sata/IDE to USB به دستگاه PS3 بنده متصل بود که بد سکتور های بیشماری هم که ایجاد شده بود ناشی از همین مطلب بوده است و قطعات قرار داده شده جهت فروش 100% سالم هستند. هر چند که 24 ساعت مهلت تست از حقوق خریدار هست و به همین جهت هم ذکر نشده بود. بیا بالا که چند ساعتی بیش باقی نمانده است... -
فروش سی پی یو مادر بورد AMD AM2+ و رم DDR2 و GTX 460
vscoder پاسخی برای vscoder ارسال کرد در تاپیک : خریدو فروش سیستم کامل و چند قطعه کامپیوتر با هم
درود دوست عزیز تا اینجا پیشکش حضور شما می شود، فقط تا آخر وقت فردا (جمعه) تحمل بفرمایید که فروش روال خودش رو طی بکند و جایی هم برای گله گذاری و یا دلخوری از سوی سایر دوستان باقی نماند. بالا باش... -
فروش سی پی یو مادر بورد AMD AM2+ و رم DDR2 و GTX 460
vscoder پاسخی برای vscoder ارسال کرد در تاپیک : خریدو فروش سیستم کامل و چند قطعه کامپیوتر با هم
قیمت ها ویرایش شد. بالا باش. -
فروش تعدادی متعلقات PS3 نظیر Move+Nav+Charger و بازی
vscoder پاسخی برای vscoder ارسال کرد در تاپیک : خرید و وفروش دستگاههای گیم و بازی
بالا باش... -
فروش سی پی یو مادر بورد AMD AM2+ و رم DDR2 و GTX 460
vscoder پاسخی برای vscoder ارسال کرد در تاپیک : خریدو فروش سیستم کامل و چند قطعه کامپیوتر با هم
درود فراوان. بعد از تست های بسیار مشخص شد که مشکل از هارددیسک سیستم بوده است که به شدت (بیش از 98 عدد) بد سکتور داشته است. لذا فروش از سر گرفته می شود. یک عدد گرافیک Zotac GTX 460 1GB AMP هم به قطعات اضافه گردید. -
فروش تعدادی متعلقات PS3 نظیر Move+Nav+Charger و بازی
vscoder پاسخی برای vscoder ارسال کرد در تاپیک : خرید و وفروش دستگاههای گیم و بازی
Up..... -
فروش تعدادی متعلقات PS3 نظیر Move+Nav+Charger و بازی
vscoder پاسخی برای vscoder ارسال کرد در تاپیک : خرید و وفروش دستگاههای گیم و بازی
درود پوزش بابت تاخیر. قیمت ها اضافه شد. بیا بالا... -
درود فراوان. متاسفانه به علت استقبال پرشور و میلیونی از این تاپیک و همینطور اوضاع به هم ریخته بازار فروش کنسل شد. از معین عزیز هم بسیار سپاسگذارم که طرح پیشنهاد کردند. فروش کنسل شد ختم تاپیک.
-
بیا بالا...
-
فروش تعدادی متعلقات PS3 نظیر Move+Nav+Charger و بازی
vscoder پاسخی برای vscoder ارسال کرد در تاپیک : خرید و وفروش دستگاههای گیم و بازی
بیا بالا... -
درود تا اینجا تقدیم شما خواهد شد معین عزیز بیا بالا...
-
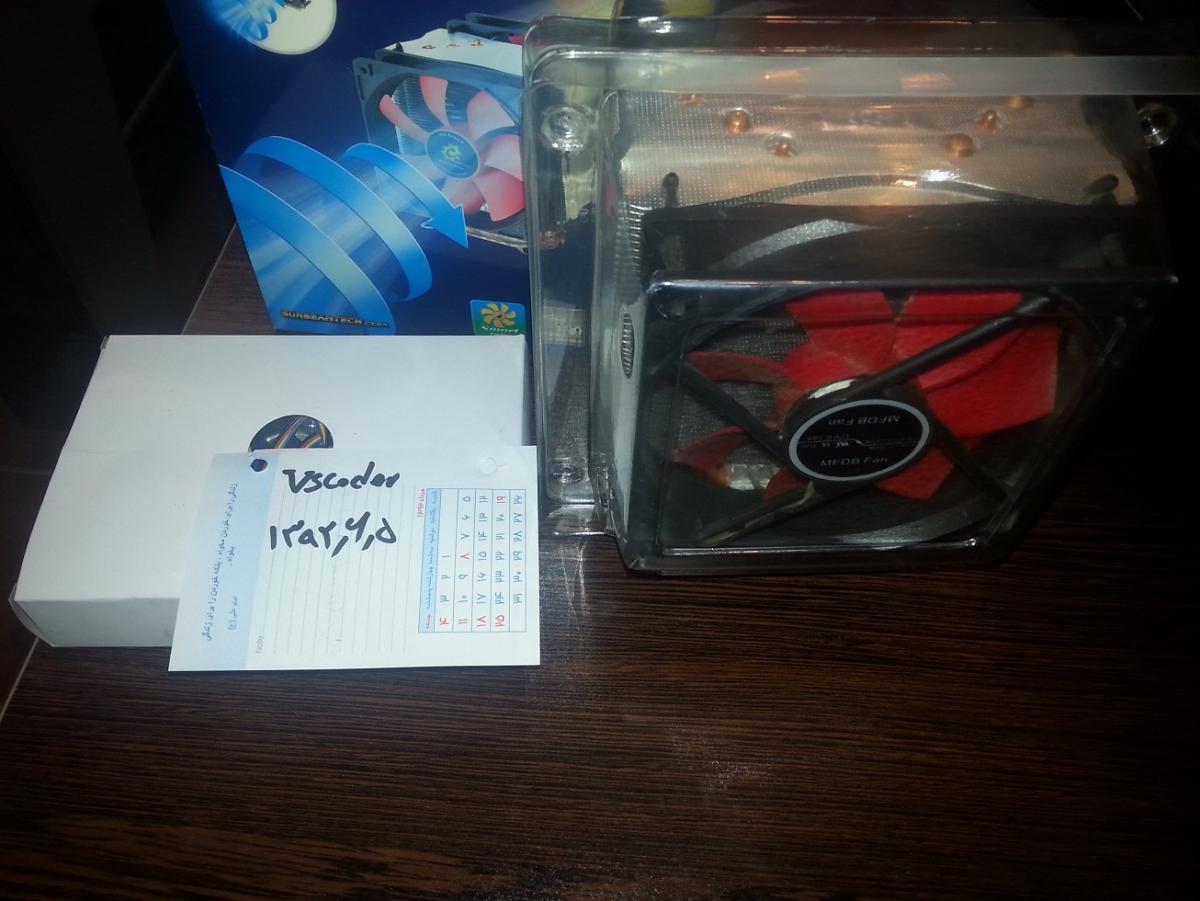
درود فراوان خدمت دوستان عزیز لیونی یک عدد کولر Green Twister 120 کارکرده به همراه جعبه و متعلقات کامل جهت فروش تقدیم حضور می گردد. کولر در سلامت کامل به سر می برد و به جز فرو رفتگی های بسیار مختصری که در محل قرار گرفتن گیره های پلاستیکی فن ها در بالای کوار ایجاد شده هیچ مشکلی ندارد. فروش کنسل شد تصاویر: تصویر اصلی 8 مگا پیکسلی برای جزئیات بیشتر http://8pic.ir/images/49575281405478316853.jpg فروش اینترنتی فقط در این فروم پیگیری می شود اما احتمال فروش خارج از فروم هم وجود دارد. بنده ساکن شهرستان گرگان استان گلستان هستم و ارسال از طریق پست یا تیپاکس انجام خواهد شد. هزینه ارسال هم بر عهده خریدار محترم خواهد بود. موفق موید باشید.

-
فروش تعدادی متعلقات PS3 نظیر Move+Nav+Charger و بازی
vscoder پاسخی ارسال کرد برای یک تاپیک در خرید و وفروش دستگاههای گیم و بازی
درود فراوان خدمت دوستان عزیز لیونی تعدادی متعلقات PS3 که شامل یک عدد کنترلر Move و دوربین و Navigation و شارژر مربوطه به این دوقلم و یک دسته اصلی PS3 و تعداد 3 عدد بازی که شامل Resistance 2 و Infamous و Sports Champion می شود را برای فروش خدمت شما عزیزان قرار می دهم. این قطعات متعلق به یکی از دوستان بسیار عزیز بنده هست و به نیابت از ایشان در این فروم قرار می گیرد. قیمت های مد نظر ایشان هم تا شب اضافه خواهد شد. تصاویر: Move + Nav + Camera + Charge + Orig Controller : http://8pic.ir/images/79583501172510563842.jpg Games : http://8pic.ir/images/85212736195838454333.jpg قیمت ها به این شرح است: شارژر مربوط به موو ونویگیشن : 150 نویگیشن کنترلر: 45 استارتر پک موو (شامل کنترلر موو، دوربین، و یک دیسک ) : 130 هر بازی :25 دسته اصلی : 90 فروش اینترنتی در این فروم پیگیری می شود اما احتمال فروش خارج از فروم هم وجود دارد. تا زمانی که قیمت های پایه درج نشده از هر پیشنهادی استقبال می شود. بنده ساکن شهرستان گرگان استان گلستان هستم و ارسال از طریق پست یا تیپاکس انجام خواهد شد. هزینه ارسال هم بر عهده خریدار محترم خواهد بود. موفق و موید باشید. -
فروش کارت گرافیک Club 3D Geforce GTX 680 4GB
vscoder پاسخی برای OverExtreme ارسال کرد در تاپیک : خرید و فروش کارت گرافیک VGA
درود بر شما دوست عزیز اگر مایل به تعویض با کارت گرافیک بنده که مشخصات آن در امضام موجوده، هستید، ممنون میشم در یک پ خ شرایط تون رو اعلام بفرمایید. لازم به توضیح است کارت بنده بسیار تمیز بوده و تا آوریل 2015 گارانتی ماتریکس دارد. موفق و موید باشید. -
درود گرفتاری زیاد است و وقت کم. به هر روی، عذرخواهم. احتمال می رود که این آپدیت دوباره روی سیستم شما نصب شده باشد. چک بفرمایید و نتیجه رو گزارش کنید: از مسیر زیر چک کنید: My Computer رو باز کنید و در نوار بالای پنجره روی Uninstall or Change a Program کلیک کنید تا صفحه حاوی برنامه های نصب شده شما ظاهر شود. سپس از سمت چپ گزینه View installed updates رو بزنید تا لیست آپدیت های نصب شده ویندوز نمایان شود. اگر آپدیت ذکر شده بالا رو در لیست دیدید Uninstall ش کنید.
-
درود بسیار مبارک باشد. ختم تاپیک
-
درود کولر در همان تاریخ فروخته شد. اما به خواست جناب تک هماهنگی ها جهت ارسال همین دیروز انجام گرفت. کولر فروخته شده و امروز حدود ساعت 2 بعد از ظهر تحویل تیپاکس شد.
-
اطلاعات حاصل از تحلیل فایل مینی دامپ: Windows 7 Kernel Version 7601 (Service Pack 1) MP (4 procs) Free x64 Product: WinNt, suite: TerminalServer SingleUserTS Built by: 7601.18113.amd64fre.win7sp1_gdr.130318-1533 Machine Name: Kernel base = 0xfffff800`02c1f000 PsLoadedModuleList = 0xfffff800`02e62670 Debug session time: Wed Jul 31 10:45:37.211 2013 (UTC - 4:00) System Uptime: 0 days 1:28:41.616 ******************************************************************************* * * * Bugcheck Analysis * * * ******************************************************************************* SYSTEM_THREAD_EXCEPTION_NOT_HANDLED_M (1000007e) This is a very common bugcheck. Usually the exception address pinpoints the driver/function that caused the problem. Always note this address as well as the link date of the driver/image that contains this address. Some common problems are exception code 0x80000003. This means a hard coded breakpoint or assertion was hit, but this system was booted /NODEBUG. This is not supposed to happen as developers should never have hardcoded breakpoints in retail code, but ... If this happens, make sure a debugger gets connected, and the system is booted /DEBUG. This will let us see why this breakpoint is happening. Arguments: Arg1: ffffffffc0000005, The exception code that was not handled Arg2: fffff8800647367a, The address that the exception occurred at Arg3: fffff880031b57f8, Exception Record Address Arg4: fffff880031b5050, Context Record Address Debugging Details: ------------------ TRIAGER: Could not open triage file : e:\dump_analysis\program\triage\modclass.ini, error 2 EXCEPTION_CODE: (NTSTATUS) 0xc0000005 - The instruction at "0x%08lx" referenced memory at "0x%08lx". The memory could not be "%s". FAULTING_IP: igdpmd64+3867a fffff880`0647367a ff5070 call qword ptr [rax+70h] EXCEPTION_RECORD: fffff880031b57f8 -- (.exr 0xfffff880031b57f8) ExceptionAddress: fffff8800647367a (igdpmd64+0x000000000003867a) ExceptionCode: c0000005 (Access violation) ExceptionFlags: 00000000 NumberParameters: 2 Parameter[0]: 0000000000000000 Parameter[1]: ffffffffffffffff Attempt to read from address ffffffffffffffff CONTEXT: fffff880031b5050 -- (.cxr 0xfffff880031b5050) rax=00730077006f0064 rbx=fffffa80075d3440 rcx=fffffa8008b85ac0 rdx=0000000001f857f0 rsi=fffffa8008b85ac0 rdi=fffffa800800af88 rip=fffff8800647367a rsp=fffff880031b5a30 rbp=fffff880031b5ae0 r8=0000000000000000 r9=0000000000000000 r10=0000000000000018 r11=fffff880031b5ae8 r12=fffffa8007491ab0 r13=fffffa800486bd30 r14=fffffa80050cb190 r15=0000000000000038 iopl=0 nv up ei pl nz na pe nc cs=0010 ss=0018 ds=002b es=002b fs=0053 gs=002b efl=00010202 igdpmd64+0x3867a: fffff880`0647367a ff5070 call qword ptr [rax+70h] ds:002b:00730077`006f00d4=???????????????? Resetting default scope CUSTOMER_CRASH_COUNT: 1 DEFAULT_BUCKET_ID: WIN7_DRIVER_FAULT PROCESS_NAME: System CURRENT_IRQL: 0 ERROR_CODE: (NTSTATUS) 0xc0000005 - The instruction at "0x%08lx" referenced memory at "0x%08lx". The memory could not be "%s". EXCEPTION_PARAMETER1: 0000000000000000 EXCEPTION_PARAMETER2: ffffffffffffffff READ_ADDRESS: GetPointerFromAddress: unable to read from fffff80002ecc100 GetUlongFromAddress: unable to read from fffff80002ecc1c0 ffffffffffffffff FOLLOWUP_IP: igdpmd64+3867a fffff880`0647367a ff5070 call qword ptr [rax+70h] BUGCHECK_STR: 0x7E LAST_CONTROL_TRANSFER: from 0000000000000001 to fffff8800647367a STACK_TEXT: fffff880`031b5a30 00000000`00000001 : fffff880`040315de 00000000`00000001 fffffa80`050cb190 fffffa80`08b85ac0 : igdpmd64+0x3867a fffff880`031b5a38 fffff880`040315de : 00000000`00000001 fffffa80`050cb190 fffffa80`08b85ac0 fffffa80`c00000bb : 0x1 fffff880`031b5a40 fffff880`040316b9 : 00000000`00000000 fffffa80`052a5000 fffff880`031b5ab0 fffff880`048aa9e7 : dxgkrnl!DXGADAPTER::IsSchedulerFlushable+0x5e fffff880`031b5a70 fffff880`04885b97 : fffffa80`08b85ac0 fffff880`031b5ac0 fffff880`031b5ae0 fffff880`048b2761 : dxgkrnl!DXGADAPTER::FlushScheduler+0xc9 fffff880`031b5aa0 fffffa80`08b85ac0 : fffff880`031b5ac0 fffff880`031b5ae0 fffff880`048b2761 fffff880`0487b6e0 : atikmpag+0xeb97 fffff880`031b5aa8 fffff880`031b5ac0 : fffff880`031b5ae0 fffff880`048b2761 fffff880`0487b6e0 00000000`00010038 : 0xfffffa80`08b85ac0 fffff880`031b5ab0 fffff880`031b5ae0 : fffff880`048b2761 fffff880`0487b6e0 00000000`00010038 fffffa80`075d3db0 : 0xfffff880`031b5ac0 fffff880`031b5ab8 fffff880`048b2761 : fffff880`0487b6e0 00000000`00010038 fffffa80`075d3db0 00000000`00000000 : 0xfffff880`031b5ae0 fffff880`031b5ac0 fffff880`0487b6e0 : 00000000`00010038 fffffa80`075d3db0 00000000`00000000 fffff880`031b5b10 : atikmpag+0x3b761 fffff880`031b5ac8 00000000`00010038 : fffffa80`075d3db0 00000000`00000000 fffff880`031b5b10 fffff880`04886c09 : atikmpag+0x46e0 fffff880`031b5ad0 fffffa80`075d3db0 : 00000000`00000000 fffff880`031b5b10 fffff880`04886c09 fffffa80`075d3440 : 0x10038 fffff880`031b5ad8 00000000`00000000 : fffff880`031b5b10 fffff880`04886c09 fffffa80`075d3440 00000000`00000000 : 0xfffffa80`075d3db0 SYMBOL_STACK_INDEX: 0 SYMBOL_NAME: igdpmd64+3867a FOLLOWUP_NAME: MachineOwner MODULE_NAME: igdpmd64 IMAGE_NAME: igdpmd64.sys DEBUG_FLR_IMAGE_TIMESTAMP: 4d0abf35 STACK_COMMAND: .cxr 0xfffff880031b5050 ; kb FAILURE_BUCKET_ID: X64_0x7E_igdpmd64+3867a BUCKET_ID: X64_0x7E_igdpmd64+3867a Followup: MachineOwner همانطور که مشاهده می کنید مشکل شما دقیقا مشابه دفعه قبل است. موفق و موید باشید.
-
درود عکسی که از صفحه مربوط به Driver Verifier گذاشتید به وضوح می گه که عامل ایجاد BSOD یکی از فایل های درایور Nvidia هست. پیشنهاد میشه یک دور درایور رو کاملا پاک کنید (Uninstall و بعدش Driver Fusion رو اجرا کرده و پس ماند های درایور رو هم پاک کنید). اگر بعد از انجام مراحل ذکر شده هنوز مشکل پا بر جا بود، علت می تواند اشکال در برق رسانی به کارت گرافیک و یا حتی خود کارت گرافیک باشد. البته اگر فایل مینی دامپ رو هم آپلود می کردید بهتر می شد. موفق و موید باشید.
-
درود فایل دامپ رو آپلود بفرمایید.
-
درود جناب تک استفاده از رسانه ارتباطی اینترنت این مشکلات رو هم به همراه دارد :D منظور مرتضی جان دوست عزیزمان کاربر H@MID بود که به یکباره خبری ازشان نشد و غیبشان زد. و بنده در طی مکاتباتی که در پیام خصوصی داشتیم، و از ان جهت که حضرتعالی هم فینگیلیش تایپ کرده بود، دچار کژفهمی شدم و گمان کردن که شما دیگر تمایلی به تهیه این کولر ندارید. بحث مادیات هم چندان مطرح نیست. کولر برایتان ارسال خواهد شد. در همین جا از شما و هم از سایر دوستان عذرخواهی می کنم. موفق و موید باشید.
-
فعالترین کاربران بازارچه
-
آمار بازخوردها
31554
مثبت15
خنثی215
منفی99%
Total Positive